
In the realm of machine learning and data science, a decision tree stands tall as one of the most popular and versatile algorithms. They are powerful tools for both classification and regression tasks, providing a clear and interpretable structure for decision-making. In this comprehensive guide, we will delve into the world of decision trees, exploring their fundamentals, terminologies, and applications, and providing illustrative examples. By the end of this journey, you'll have a solid understanding of decision making trees and how they can be applied in real-world scenarios.
What is a Decision Tree?
A decision tree (D-tree) is like a flowchart used to make predictions in machine learning also known as Decision Making Tree. Each box in the chart represents a decision based on input, leading to different outcomes. It keeps making decisions based on the best way to split the data until it reaches a stopping point. Decision Trees can work with different types of data and are good for tasks like classification and regression.
They're easy to understand and can handle complex relationships between variables. But sometimes they can get too detailed. So, predicting too closely to the training data and not performing well on new data. To fix this, techniques like pruning or using multiple trees together can help.
Decision Tree Model
A decision tree model is like a smart guesser made by teaching a computer using a D-tree method. First, it learns from a bunch of examples we give it. Then, it can guess what might happen with new examples we haven't shown before. These models are great because they're easy to understand, which is handy when we want to know why it made a certain guess.
Decision Tree Terminologies
Before diving deeper, let's familiarize ourselves with some key terminologies of decision making tree:
- Root Node: The top part of the D-tree shows the first choice or question you start with.
- Decision Nodes: Nodes in the tree are like stops where you make decisions based on certain things you're looking at.
- Branches: The paths you take from one stop to another in the tree show what could happen based on the choices you make.
- Leaf Nodes: The end parts of the tree show what finally happens or what category something belongs to.
- Splitting: Splitting means breaking a stop into smaller stops depending on certain things we're looking at.
- Pruning: Pruning is like trimming branches of a tree to keep it from getting too messy and confusing.
- Entropy: Entropy is like how messy or mixed up the information is. Decision-making trees try to make things less messy at each stop.
Decision Tree Diagram
A decision tree diagram visually represents decisions and their possible consequences. It's an effective tool for analyzing choices, outcomes, and potential paths forward.
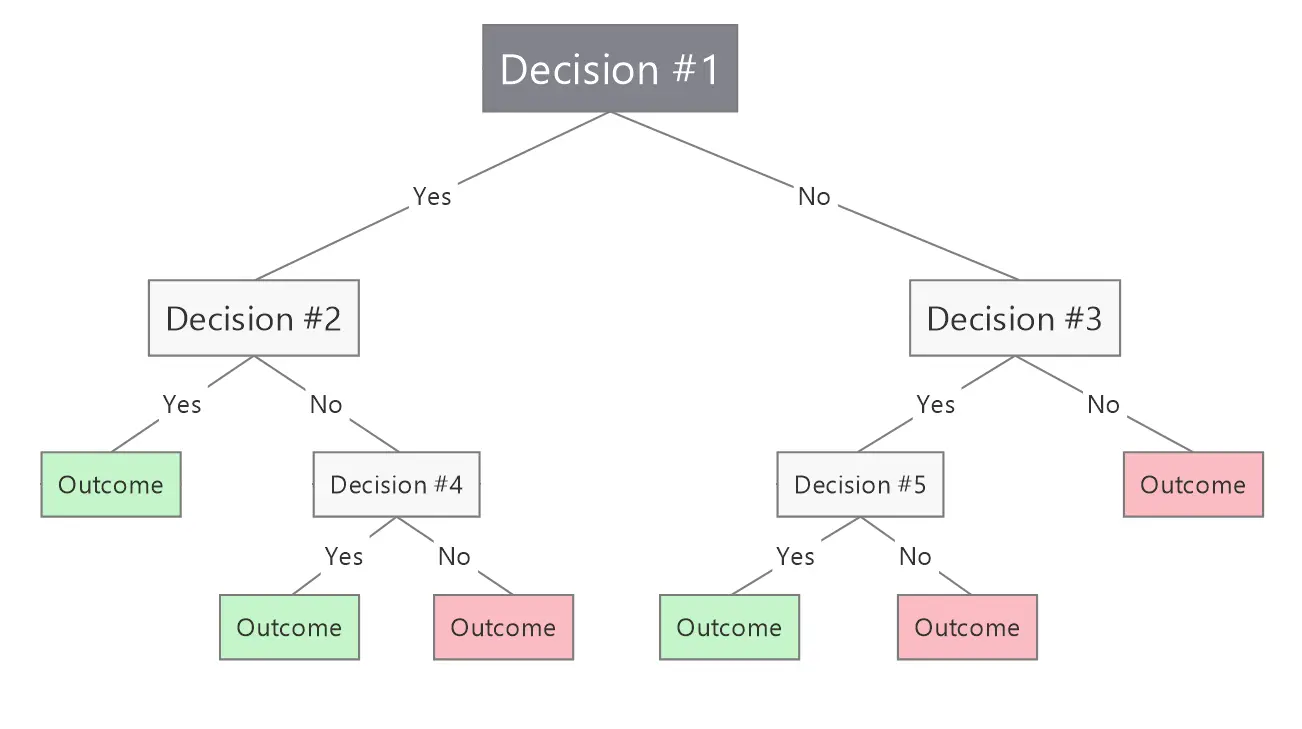
Here's a simple picture showing how to decide whether to play tennis based on the weather. So, it begins with a main choice about the outlook (sunny, overcast, or rainy). Then, it splits into different choices depending on the weather. Each choice leads to a final decision: play or don't play tennis.
Best Decision Tree Software
You can make D-trees by hand, but there are also computer programs that make it easier. These programs help you see the tree and make it better. They can also check if the tree works well and make it even better. Some of the best decision tree software options include
- Scikit-learn: A famous computer tool in Python that helps make decision trees and other things work faster and better.
- RapidMiner: There's a strong computer program for data science that's easy for people to use to make decision trees and other smart computer models.
- Weka: There's a free computer toolbox for teaching computers to learn different things. It has lots of tools, including decision making trees, and ways to show the information visually.
- KNIME: There's another free computer program for studying data that lets people create D-trees by moving things around on the screen.
- Orange: A visual programming tool for data visualization and analysis, which also includes modules for building decision trees.
Decision Chart
A decision chart is like a picture that helps make decisions, often used in business or managing projects. It's a bit like decision trees but simpler, focusing more on steps and results than on lots of branches. People use them to make hard decisions easier and get things done faster.
Benefits of Using Decision Making Tree
Decision trees are a popular and versatile tool in machine learning and data analysis for several reasons:
- Easy to understand and interpret, like a flowchart.
- Can handle both numerical and categorical data.
- Versatile, and suitable for both classification and regression tasks.
- Able to capture complex relationships between variables.
- Provide clear insights into which features are important for prediction.
- Require minimal data preprocessing.
- Can handle missing values and outliers without much preprocessing.
- Can be visually presented for easy communication of results.
Decision Tree Examples
Let's illustrate the concept of a decision making tree with a couple of examples:
- Credit Risk Assessment: Imagine a bank that wants to check if someone might not pay back a loan. So, they look at things like how much money they make, their credit score, and how much they want to borrow. Also, by using a decision tree made from past loan information. The bank can guess if a new person might not pay back their loan.
- Customer Segmentation: In marketing, trees help divide customers by things like age, what they buy, and what they like. Also by looking at old sales info, a company can find trends and make special ads. For different groups of customers.
Learners Also Read: What are Searching and Sorting Techniques in Data Structure?
Conclusion
In conclusion, decision trees are helpful in machine learning and making decisions in different industries. This guide explained the basics of decision making trees and their terms. As well as how they're used with examples like predicting credit risk and dividing customers for marketing. They're great because they're easy to understand and there are tools to help, making them useful for everyone. As businesses aim to make better decisions, decision trees become even more important. For guiding them toward success in a world driven by data.
Frequently Asked Questions
Ans. Decision trees help decide by showing paths and results, often used in data analysis. Fishbone diagrams help find reasons for a problem by showing possible causes branching from the main issue. It focuses on choices, while fishbone diagrams focus on causes.
Ans. Decision trees show choices and results in a tree-like way, good for guessing outcomes in data. Flowcharts show steps in a process, useful for explaining how things work. It focuses on choices and results, while flowcharts focus on steps and actions.


